

By Anna Wang | April 30, 2026
Not long ago, while working on this project, I made a mistake that ended up inspiring the topic I am exploring today. I was working with the eBird dataset and began drawing conclusions from its numbers without stopping to ask the basic question: who actually put those numbers there? Soon after digging into that question, I discovered that it undermined my entire analysis. Because I was working with crowdsourced data, the data was not just telling me about birds, it was also telling me about the birders behind it.
eBird is the world's largest citizen science bird database, managed by the Cornell Lab of Ornithology. It serves as both a tool for the average backyard birder to log their sightings and a research resource used by scientists to track migrations, monitor at-risk species, and inform conservation decisions. With over 100 million observations and counting, it is one of the most significant wildlife datasets ever assembled. However, when a crowdsourced dataset is so reputable and widely used, it can be easy to fall into a sense of false comfort and treat its numbers as fact.
Data is shaped by the people who collect it. Every observation in eBird is made by a person who chose to go outside, chose a place to visit, and chose a day to do it. As a result, these observations reflect their income, geography, work schedules, and habits. The question worth asking, then, is not just what eBird tells us about birds, but what it tells us about the people doing the watching, and how those patterns shape the conclusions we can draw from the data.
Our approach will be to dig into each of the following: who is contributing the data, when they are collecting it, and where they are going.
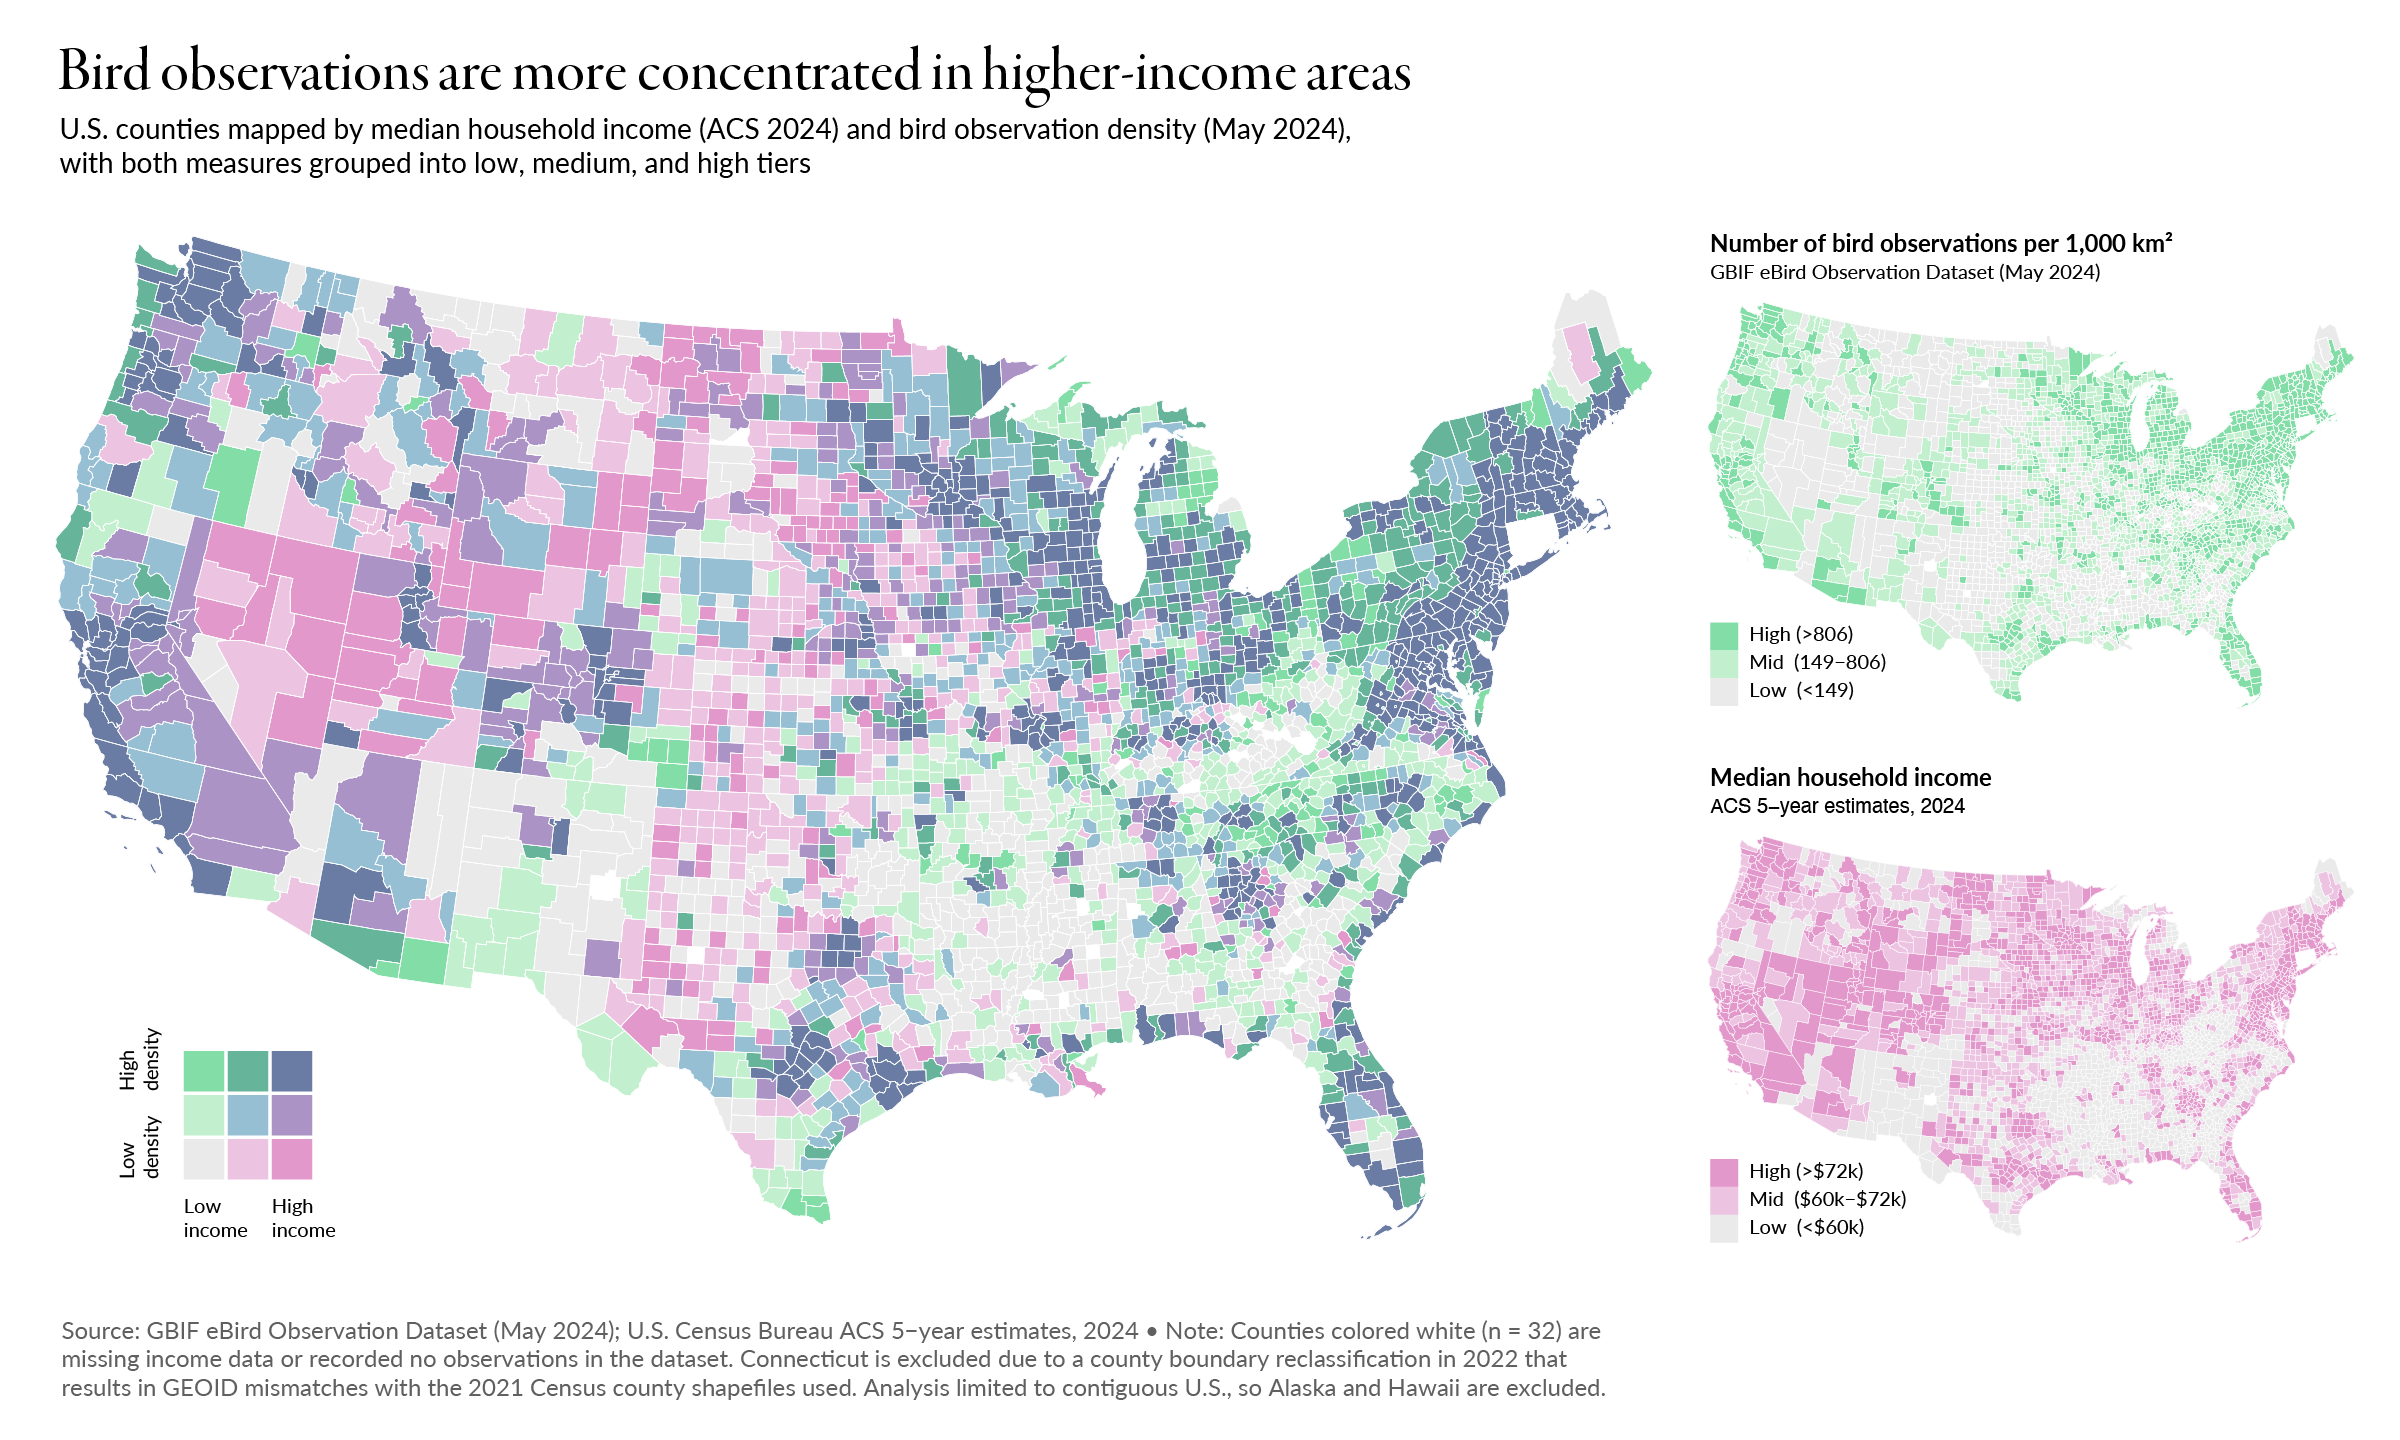
Looking first at who is contributing observations, we notice that wealthier counties consistently generate far more observations, even after normalizing for differences in county size. The clustering is visible and follows some geographic patterns. Coastal areas, major metropolitan corridors, and the wealthier parts of the Northeast and Pacific Northwest dominate the record, while large stretches of the rural South, Appalachia, and the Great Plains are comparatively absent.
What this tells us about the dataset is that its geographic coverage is uneven in a way that tracks with socioeconomic access rather than solely bird presence. If observation density is used as a proxy for ecological conditions, this kind of uneven participation can make some regions appear quieter than they actually are, not because there's less birds but because fewer people are recording them.
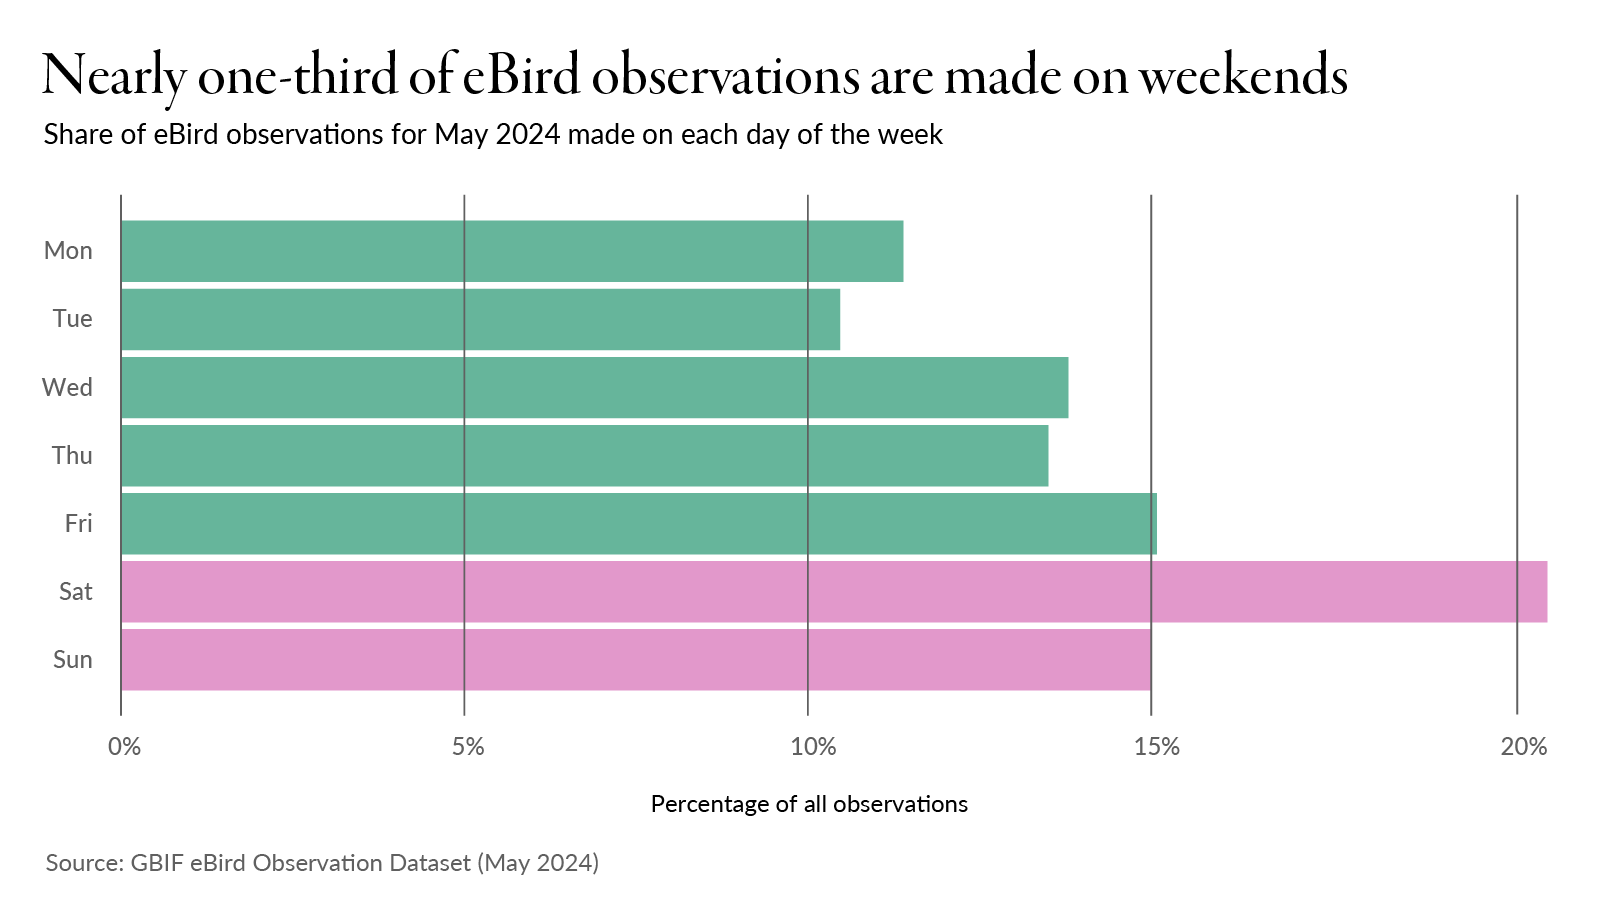
We can learn even more about the human behavior influencing eBird data when we look at when observations are being made. In May 2024, nearly one in three eBird observations was submitted on a Saturday or Sunday. Weekdays, Tuesday through Thursday in particular, make up a noticeably smaller share of the record.
The majority of eBird contributors appear to have conventional work schedules and get outside most on weekends. Patterns of bird activity that play out midweek, or that differ between weekdays and weekends in heavily visited areas, end up less thoroughly documented simply because fewer people are out there to observe them.
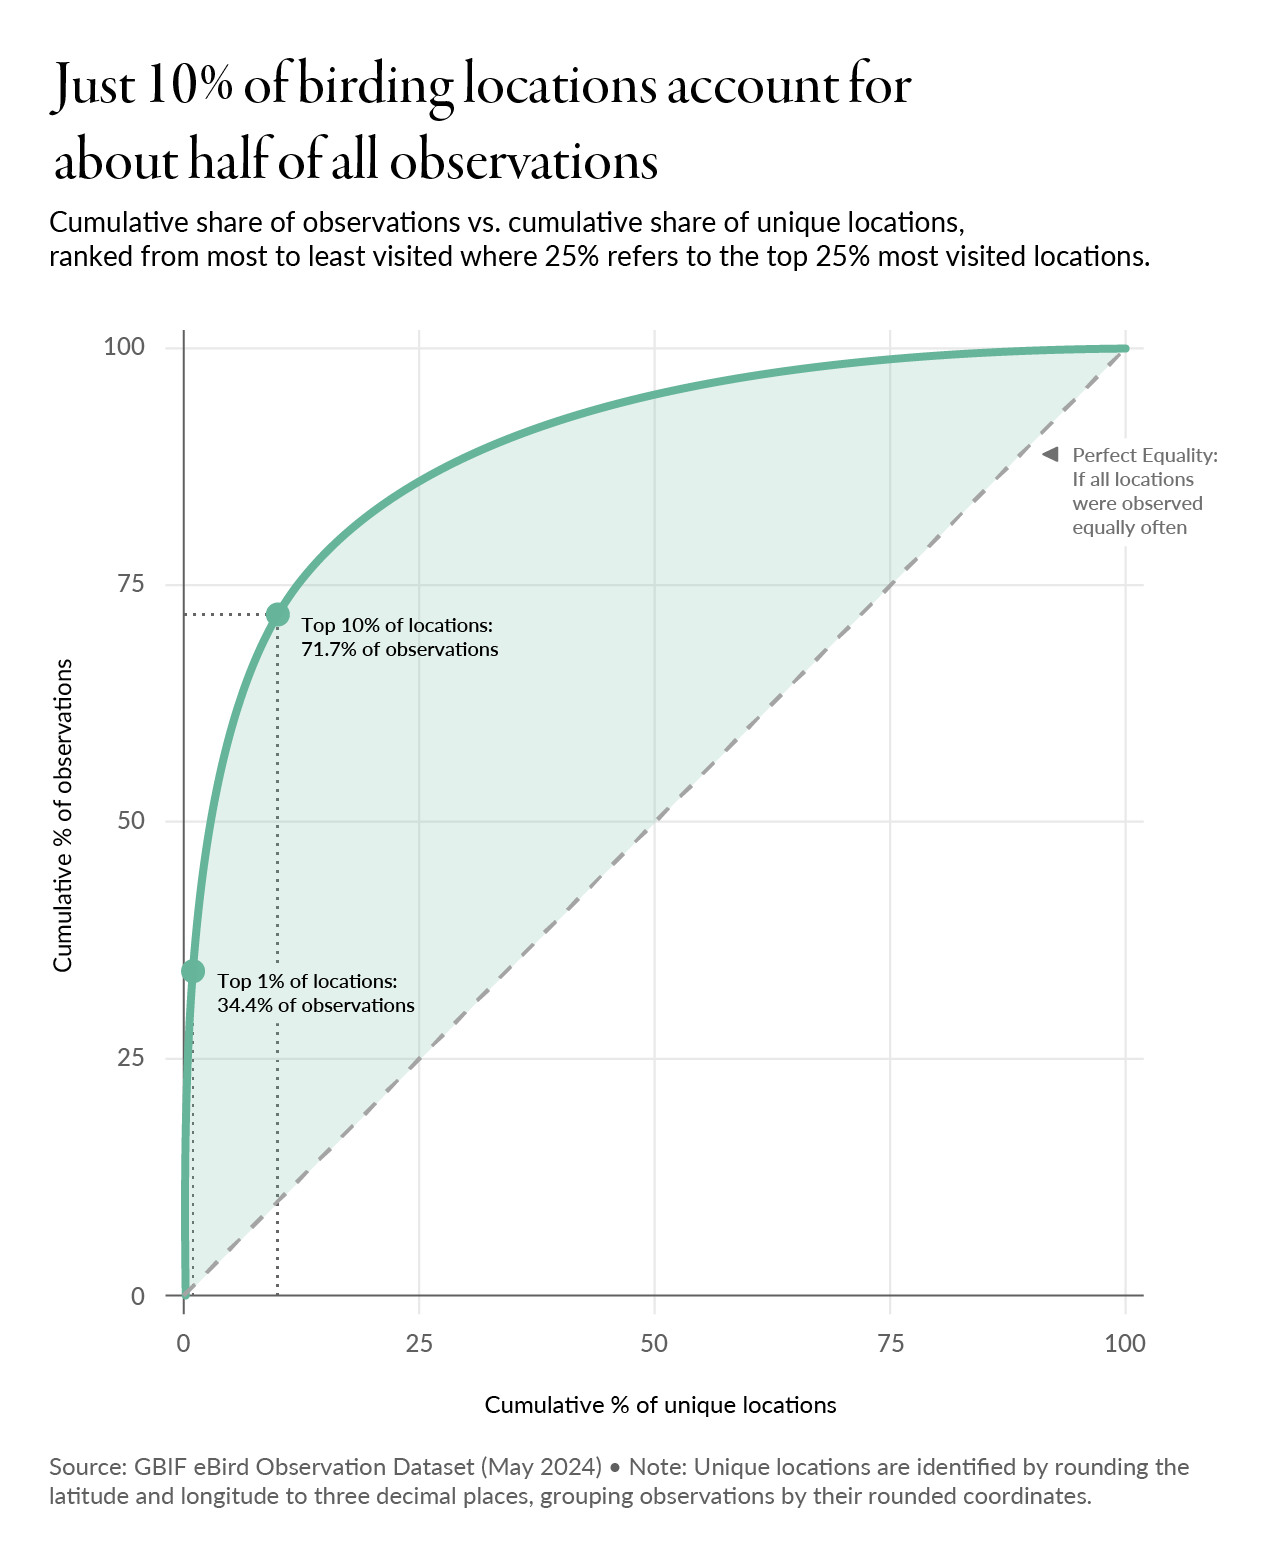
So far, we've looked at who is contributing and when observations are made. The next question is where these observations are happening. Looking at how observations are distributed across unique locations, we find that the top 10% of locations in the May 2024 dataset account for roughly half of all observations. The majority of locations appear only once or twice.
eBird's Hotspot system helps explain this. The platform maintains a network of named, community-designated locations, from parks to wildlife refuges, to well-known birding spots, that accumulate checklists over time and appear on the eBird hotspot map. These places attract repeat visitors, both local regulars and traveling birders. As a result, a small number of well-known locations have gradually come to represent a disproportionate share of the record.
None of this is a reason to distrust eBird. The platform has contributed enormously to wildlife science, and researchers who rely on it professionally are well aware of these limitations and have developed methods to account for them. However, it's also important for the average person to be aware of the inherent biases that are present when they use or consume content using this data.
Just like with eBird in this project, I invite us all to carry a little more curiosity into any encounter with a large, crowdsourced dataset. Not skepticism for its own sake, but the habit of asking who contributed, when, and from where, to get the full story before drawing conclusions about what the numbers may mean. Citizen science platforms like eBird are truly such amazing tools, but they work best when the people using them understand the people behind them.
This project draws on two primary datasets. Bird observation data was obtained from GBIF using the eBird Observation Dataset contributed by the Cornell Lab of Ornithology, filtered to include only observations from the United States during May 2024. Only May is used to keep the dataset to a manageable size, along with it being the peak birding month of the year. The dataset used here contains over 21 million observations across roughly 900 bird species.
Socioeconomic data comes from the U.S. Census Bureau's American Community Survey (ACS) 5-year estimates for 2024, specifically the DP03 table which provides median household income at the county level. County boundary shapefiles are from the U.S. Census Bureau TIGER/Line dataset.